





Latest industry test datasets show up to 40% variation in measured pressure drop and roughly 20% variation in leak rates across common designs, highlighting test-method sensitivity and design trade-offs. This report explains objectives and metrics for evaluating UQD connector performance for design engineers, test labs, and procurement teams.
Scope covers measurable metrics: flow (Cv and L/min), pressure (operating, burst, pressure drop) and leak (leak rate and test methods). The aim is to provide reproducible test guidance, benchmark interpretation, and actionable selection steps for liquid-cooling systems and rack-level deployments.
UQD Connector Overview: Design, Standards & Key Specs
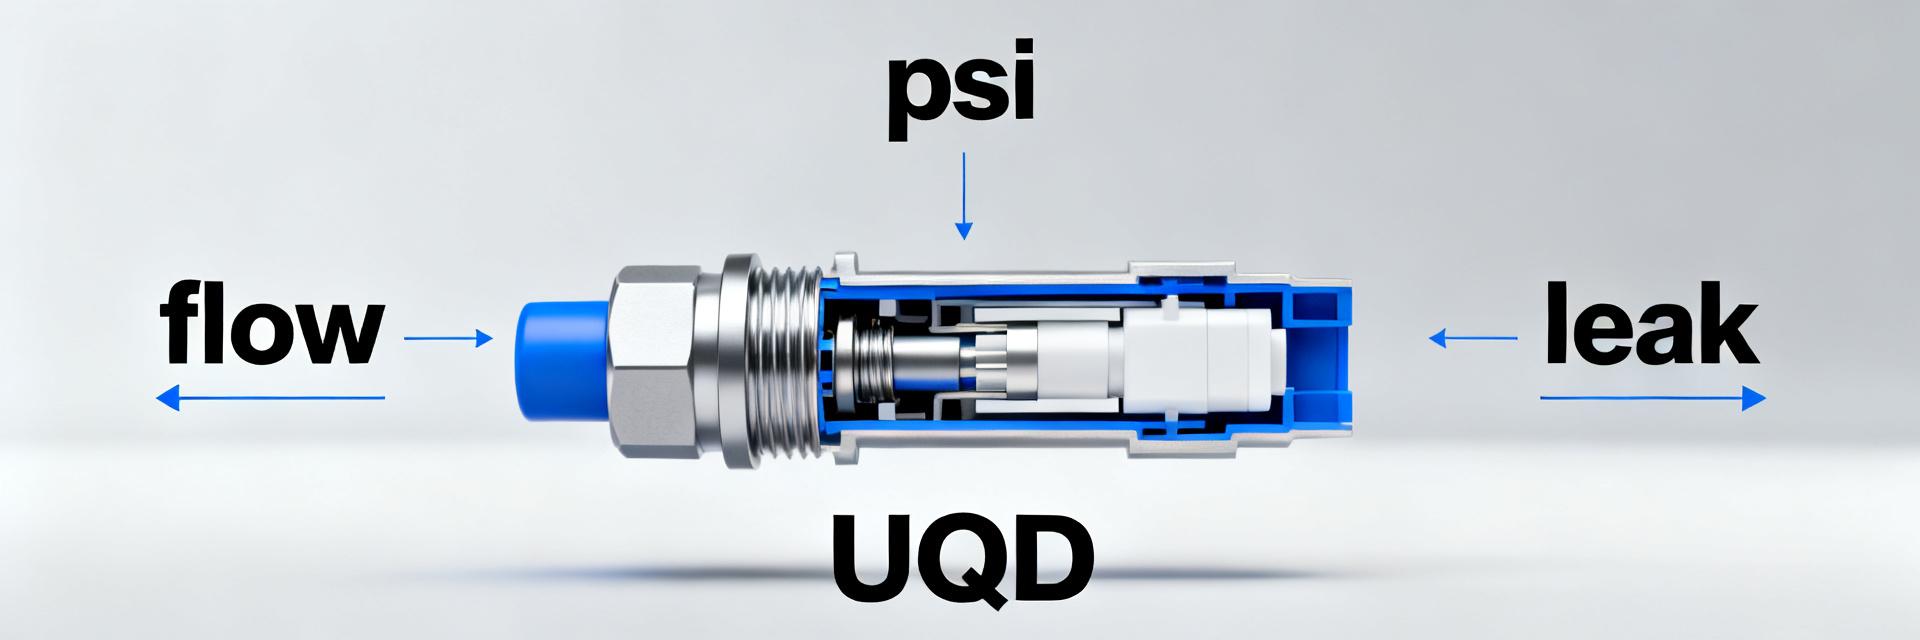
What defines a UQD connector
Point: A UQD connector is a hand-mated, dry-break coupling designed for repeatable liquid cooling connections.
Evidence: Industry datasets and functional test reports emphasize push-pull actuation, integrated valves, and guided alignment.
Explanation: Designers should call out nominal diameters, misalignment tolerance, sealing approach (elastomer vs metal-seat) and valve sequencing on datasheets.
Typical standard sizes and pressure/flow ratings
Point: UQD form factors span small to medium diameters optimized for rack manifolds.
Evidence: Example industry ranges show nominal diameters mapped to tens to hundreds of psi operating windows.
Explanation: Readers should expect datasheet entries for nominal bore, typical max operating pressure range and representative flow capacity to assess compatibility with system loops.
| Nominal size | Max operating pressure (psi / bar) | Representative flow (L/min) |
|---|---|---|
| 6 mm | 150–300 psi / 10–20 bar | 1–5 L/min |
| 12 mm | 150–500 psi / 10–35 bar | 5–25 L/min |
| 16 mm | 200–800 psi / 14–55 bar | 20–60 L/min |
Flow Performance: Cv, Flow Rate Curves & Pressure Drop
Key flow metrics to measure and report
Point: Report Cv, flow in L/min, and Reynolds regime to characterize hydraulic behavior.
Evidence: Consistent Cv reporting enables system-level pressure budgeting; test points should include low, nominal and high flow.
Explanation: Supply flow vs. pressure-drop curves sampled across incremental flow setpoints and stated fluid properties to make data comparable.
How to interpret and benchmark Cv and pressure-drop data
Point: Normalize Cv by nominal diameter to compare designs fairly.
Evidence: Normalized Cv or % pressure drop at nominal flow highlights loop impact.
Explanation: Benchmark thresholds can be set (example: <5% loop pressure budget for connectors at nominal flow) and visuals should include normalized Cv plots and percent pressure-drop bars for quick selection.
Pressure Behavior: Operating, Burst & Dynamic Response
Recommended pressure tests and acceptance criteria
Point: Use static proof, endurance cycling at working pressure, and burst testing with safety margin.
Evidence: Industry test protocols typically apply multiple cycles with dwell times and incremental pressure steps.
Explanation: Acceptance criteria should specify pass/fail for no leakage and no permanent deformation, with tabulated working and burst pressures and applied safety factors.
Mapping pressure drop under load and transients
Point: Capture steady-state and transient pressure behavior during flow steps and mating events.
Evidence: Transient plots reveal spikes, cavitation risk and recovery time after demating.
Explanation: Include pressure-time traces for mating/demating and step-change flow to demonstrate dynamic response and any pressure spike mitigation needs in system design.
Leak Performance: Test Methods & Reporting
Leak test methods (helium, bubble, mass-loss, tracer)
Point: Select a leak method matching sensitivity needs: helium for high sensitivity, bubble for production screening, mass-loss for bulk loss.
Evidence: Each method has qualitative sensitivity ranges and throughput trade-offs.
Explanation: Report units in scc/s or mg/min, state environmental conditioning, and justify method choice for R&D versus production verification.
Acceptance limits, contamination risk and air ingress
Point: Define leak-rate thresholds by application: data-center loop vs electronics-grade requirements differ.
Evidence: Small air ingress can degrade coolant and introduce particulate.
Explanation: Document acceptable leak rates, contamination risk assessment, and recommended failure documentation including ingress pathway and particulate observations.
Test Setup & Best Practices for Repeatable Measurements
Fluid selection, temperature control & flow conditioning
Point: Report fluid density, viscosity and temperature; control temperature during tests.
Evidence: Viscosity change with temperature alters Cv and pressure drop significantly.
Explanation: Use flow straighteners, reservoir conditioning and purge procedures; include fluid spec table when publishing flow/pressure curves to allow reproducibility.
Instrumentation, uncertainty analysis & data logging
Point: Specify instrument accuracies, calibration status and sampling frequency.
Evidence: Pressure transducers ±0.1%–0.25% and flow meters with stated uncertainty reduce ambiguity.
Explanation: Present uncertainty bands on plots, provide a reproducible test-report checklist and a sample CSV column list (timestamp, flow L/min, pressure psi, temp °C, instrument ID).
System Integration Implications & Actionable Recommendations
Engineering selection checklist
Point: Use a compact checklist to map connector attributes to system needs.
Evidence: Matching Cv to loop flow avoids oversized pressure drop.
Explanation: Checklist items: verify nominal Cv vs loop flow, confirm operating pressure margin, confirm leak-test method and certification, and check misalignment tolerance for field mating and serviceability.
Installation, maintenance and troubleshooting tips
Point: Define best practices for mating, torque, alignment and periodic checks.
Evidence: Common failures map to external clogging, sealing wear, or improper mating force.
Explanation: Include a short decision tree: if high pressure drop then inspect for clogging; if localized leak then inspect seal surface and valve sequencing; follow periodic leak-check schedule and post-event inspection steps.
Summary
- Establish standardized tests that report Cv, flow (L/min), and pressure behavior with stated uncertainty so system impacts are quantifiable and comparable for selection.
- Use targeted leak methods by sensitivity need: bubble or mass-loss for production screening, tracer or helium for R&D verification and failure analysis.
- Normalize Cv and present percent pressure drop at nominal flow to evaluate system delta-T effects and ensure connector contribution fits loop budgets.
- Follow an engineering checklist to match connector hydraulic capacity and pressure margin; document mating tolerances and maintenance procedures for reliable field service.
Frequently Asked Questions
What flow test points should be included for reliable UQD connector flow rate testing?
Include at minimum three flow points: low (10% nominal), nominal (system design flow) and high (150% nominal) with steady-state pressure readings and repeated runs to characterize hysteresis. Report fluid properties and instrument uncertainty for each point to enable comparisons.
What acceptance criteria are typical for UQD connector pressure testing?
Define working-pressure endurance cycles with dwell times and a burst test target that applies an industry safety factor above working pressure. Acceptance typically requires no leak and no visible deformation after endurance cycling; report cycle count, dwell, and pass/fail metrics clearly.
Which leak-rate units and thresholds should engineers specify for data-center applications?
Report leak in standard units (scc/s or mg/min) and set thresholds by application risk: data-center loops tolerate higher micro-leak than electronics-grade assemblies. Document environmental conditioning, test method sensitivity, and consequences of air or particulate ingress in selection reports.
How does fluid temperature impact UQD pressure drop measurements?
Fluid temperature directly changes coolant density and dynamic viscosity. Because pressure drop and Cv calculations are highly sensitive to viscosity variations, failing to control and document fluid temperature will compromise test reproducibility and lead to inconsistent benchmarking results.


