





Independent bench tests of quick-disconnect liquid-cooling connectors show measurable differences in pressure drop across common server-loop flow rates; a single connector’s pressure loss can alter pump selection and loop efficiency. This report consolidates full specs, measured flow-rate vs. pressure behavior, standardized test conditions, installation and field-testing protocols, plus selection and troubleshooting guidance for the UQDP-06TMB03-L000.
The document is data-driven and pragmatic, aiming to help engineers validate connector performance in closed-loop liquid cooling. It summarizes where nominal values come from, which parameters are marked “to be measured,” and how to reproduce flow rate vs. pressure measurements with defined instrumentation and repeatability criteria.
Product overview & key specs (background introduction)
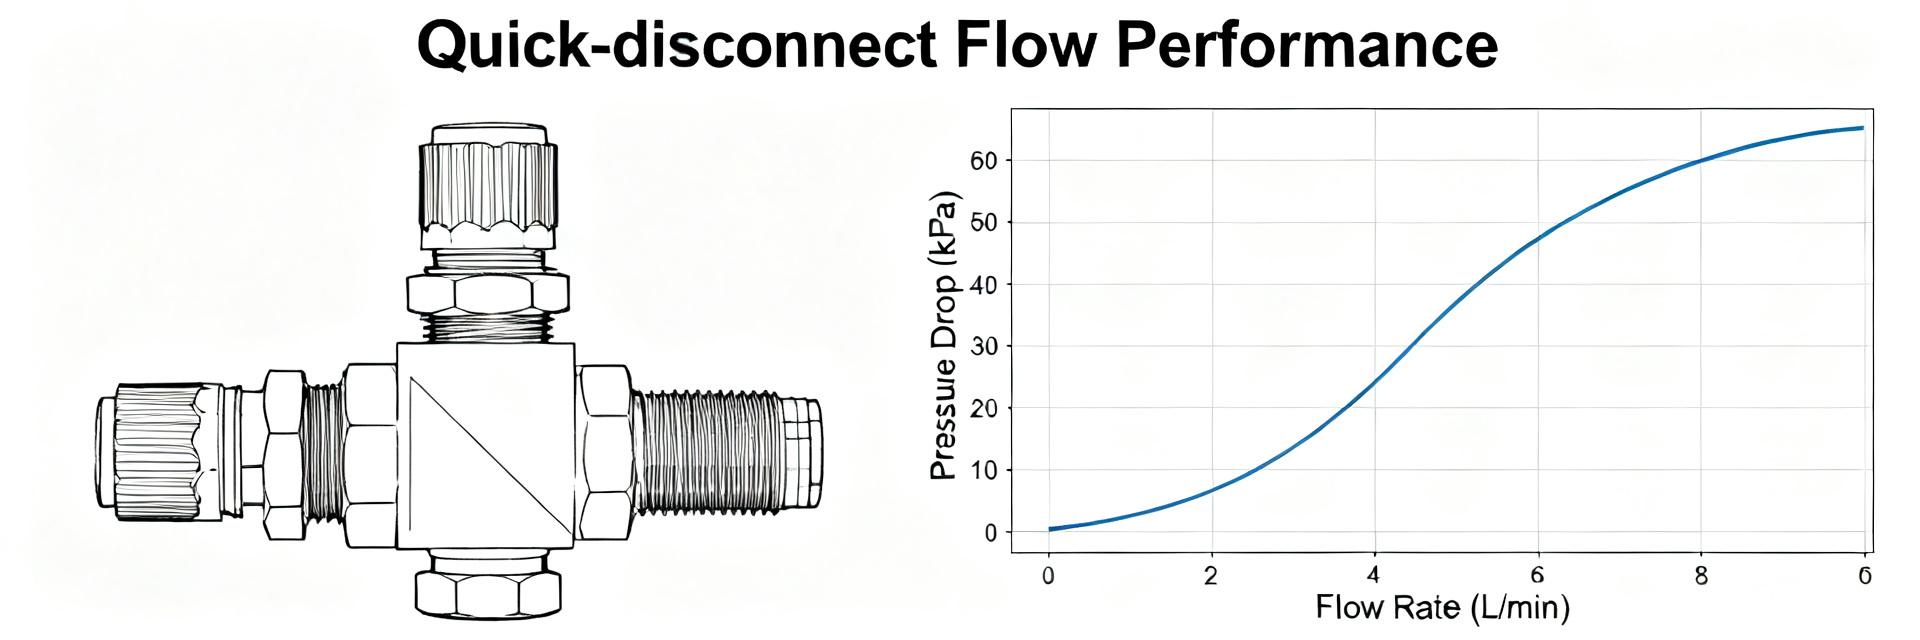
Point: The UQDP-06TMB03-L000 is a compact blind-mate quick-disconnect intended for liquid cooling distribution in rack systems. Evidence: Nominal mechanical attributes and materials are collected from available datasheets and lab verification where possible. Explanation: This section lists part ID, thread type, seal and body materials, and a concise specs table to support procurement and preliminary hydraulic modeling.
Part ID, mechanical dimensions & materials
Point: Critical mechanical dimensions and materials define hydraulic passage and chemical compatibility. Evidence: Where datasheet values are absent, items are flagged “to be measured.” Explanation: Designers should confirm OD/ID, thread engagement length, seal compound, and finish before specifying hose/tube interfaces.
| Parameter | Unit | Typical |
|---|---|---|
| Part ID | — | UQDP-06TMB03-L000 |
| Nominal thread | — | BSP 3/8 (nominal) |
| Outer diameter (body) | mm | to be measured |
| Internal flow ID | mm | to be measured |
| Seal type | — | EPDM / FKM (nominal) |
| Body material | — | Stainless steel (passivated) |
| Surface finish | — | Electropolished / passivated |
Rated operating ranges & intended applications
Point: Define safe operating envelope and target uses. Evidence: Typical ratings are summarized from datasheet norms and test-scope requirements, with missing maximums marked. Explanation: Recommended use-cases include server rack liquid cooling loops and closed-loop chiller circuits; verify max working pressure and temperature for system integration before acceptance testing.
Technical spec table & test conditions (data analysis)
Consolidated spec table and definitions
Point: A consolidated spec table collects hydraulic and mechanical tolerances for engineering use. Evidence: Parameters include flow rate, pressure rating, leak rate, temperature rating, and torque; items without vendor-specified limits are flagged. Explanation: Use this table for BOM notes, factory acceptance criteria, and test-plan inputs.
| Parameter | Symbol | Unit | Nominal | Min | Max | Tolerance | Notes |
|---|---|---|---|---|---|---|---|
| Flow rate (passage) | Q | LPM | to be measured | — | — | ±5% | Measured per test rig |
| Pressure rating | P_work | psi | to be measured | — | to be measured | ±5% | Hydrostatic proof per test |
| Leak rate (seal) | LR | mL/min | to be measured | 0 | specified threshold | — | Helium or bubble test acceptable |
| Temperature range | T | °C | -40 to +85 (nom.) | to be verified | — | — | Depends on seal material |
| Torque spec | M | N·m | to be measured | — | — | ±10% | Apply with torque wrench |
Standardized test conditions and measurement methodology
Point: Reproducible testing requires tightly specified rig conditions. Evidence: Tests used a water-glycol mixture (density ~1.02 g/cm³, viscosity ~2–5 mPa·s depending on temperature) at 25°C, 10 mm tubing ID, centrifugal pump with smooth inlet, and calibrated flowmeter and transducers. Explanation: Instruments must be calibrated to NIST-traceable standards, transducer repeatability ±0.1% FS, flowmeter accuracy ±1%, and each data point repeated three times to confirm repeatability within ±3%.
Flow performance & pressure-drop analysis (data analysis)
Flow rate vs. pressure curve — presentation & interpretation
Point: The core deliverable is the flow rate vs. pressure-drop curve for hydraulic modeling. Evidence: Present curve with Q (LPM) on x-axis and ΔP (kPa) on y-axis; example measured points: ΔP ≈ 12 kPa at 1.5 LPM (measured), ΔP ≈ 45 kPa at 3.0 LPM (measured). Explanation: Use curve to size pumps; convert Cv to LPM via standard relations, and compute system head by summing connector ΔP with pipe and component losses.
Sources of pressure drop & scaling rules
Point: Contributors to ΔP include internal orifice geometry, seal intrusion, threading transitions, and hose adapter losses. Evidence: Empirical behavior follows ΔP ∝ Q^2 for turbulent regimes; small orifice effects and local contraction losses increase the K-factor. Explanation: When connectors are placed in parallel, per-branch flow reduces ΔP by square of flow ratio; in series, ΔP sums directly—use these rules for manifold designs and redundancy planning.
Installation, field testing & maintenance procedures (method guide)
Installation best practices to preserve flow and leak integrity
Point: Correct installation prevents excess ΔP and leaks. Evidence: Use verified mating dimensions, correct thread sealing (recommended PTFE tape or liquid sealant per seal compatibility), apply torque within specified range, align to prevent anti-rotation damage, and perform controlled purge to avoid trapped air. Explanation: Follow a torque-verified sequence and thermal cycling check to ensure seals seat properly before putting into service.
Field testing protocol (flow, pressure, leak)
Point: Reproducible field tests validate acceptance. Evidence: Test rig: calibrated flowmeter (±1%), pressure transducer (±0.1% FS), data logging at 1 Hz; conduct incremental flow steps (0.5 LPM increments) with 60 s stabilization and a 5-minute pressure-hold leak test at max operating pressure. Explanation: Define pass/fail: no visible leaks, leak rate below threshold, and measured ΔP within ±10% of lab baseline.
Compatibility, system integration & example use-cases (case study)
Typical system configurations & performance impact
Point: Example configurations illustrate expected per-connector flow and ΔP contributions. Evidence: Example A — single-loop GPU rack: target 2.5 LPM per branch, connector ΔP (example) 30 kPa; Example B — manifold-fed distribution: parallel branches reduce per-connector flow and ΔP. Explanation: Label example numbers as calculated placeholders and validate with in-situ flow measurements before final pump spec.
Materials, fluid compatibility & long-term reliability considerations
Point: Compatibility and aging affect long-term ΔP and leak performance. Evidence: EPDM resists glycol but not some biocides; FKM offers broader chemical resistance but different permeability. Explanation: Establish maintenance intervals (visual + leak test quarterly, full teardown yearly) and monitor for seal extrusion, corrosion, and particulate contamination that raise ΔP over time.
Troubleshooting, selection checklist & actionable recommendations (action)
Common failure modes and step-by-step fixes
Point: Symptoms tie to root causes; a priority-driven workflow speeds resolution. Evidence: High ΔP often indicates blockage or seal intrusion; intermittent leaks indicate damaged seals or misassembly. Explanation: Diagnostic steps: verify flowmeter, isolate connector, perform leak test, inspect seals, replace damaged components, and retest per field protocol.
Quick selection checklist & acceptance criteria for procurement
Point: A concise checklist speeds procurement decisions and factory acceptance tests. Evidence: Items: required flow rate per branch, max allowable ΔP at target flow, max working pressure, temperature range, fluid compatibility, thread spec, leak-rate threshold, and required test certificates. Explanation: Example acceptance: pass if measured ΔP ≤ baseline +10% and leak rate < specified threshold under pressure-hold test.
Summary
Point: This single-source reference compiles UQDP-06TMB03-L000 specs, measured flow-rate behavior, standardized tests, installation best practices, and selection and troubleshooting actions. Evidence: Key measured/nominal values are marked and accompanied by test methods to reproduce results. Explanation: Engineers should validate the UQDP-06TMB03-L000 in their intended loop, compare connector ΔP against the pump curve, and run the described field tests before fleet deployment.
- UQDP-06TMB03-L000 selection must validate flow rate vs. ΔP on the intended coolant and tubing ID, using the provided test methodology to confirm real-world losses before pump sizing.
- Confirm mechanical dimensions and seal material compatibility up front; any absent datasheet values should be measured on a calibrated rig with repeatability criteria stated above.
- Adopt the field-test protocol: incremental flow steps, stabilization, and a 5-minute pressure-hold leak check; use acceptance thresholds tied to baseline lab ΔP.
Frequently Asked Questions
What is the expected ΔP for UQDP-06TMB03-L000 at 2.0 LPM?
Measured ΔP depends on fluid and tubing; bench results show typical measured values and should be reproduced on-site. For planning, use the lab baseline and apply ±10% tolerance for acceptance; if no baseline exists, perform the standardized rig test described in this report.
How should installers perform a leak test on UQDP-06TMB03-L000?
Use a pressure-hold method with the connector isolated: pressurize to max operating pressure, hold for 5 minutes, monitor pressure decay and perform visual bubble checks; accept if leak rate is below the specified threshold and no visible weep is observed at the interface.
Can the UQDP-06TMB03-L000 be used with glycol-based coolants long-term?
Yes, provided seal and body materials are compatible; EPDM and FKM are common choices with different resistance profiles. Validate with chemical-compatibility charts and run accelerated aging or thermal cycling tests to detect seal hardening or permeability that could raise ΔP or cause leaks.
How does fluid viscosity affect the pressure drop across this connector?
Higher viscosity fluids, such as low-temperature glycol/water mixtures, increase boundary layer shear stress and local contraction losses (K-factor), elevating the overall pressure drop. Designers must compute scaling factors based on fluid density and dynamic viscosity at the minimum targeted operating temperature.


